Game Jolt had a rough week
If you visited us in the past few days, you may have noticed something’s gone terribly wrong. Errors all over the place, sometimes failures to connect, new games listing oddly stale, game views/downloads stopped increasing and if you listened real closely you may have heard a faint distant screech 
This is our story. Disclaimer: It’s a bit technical!
Not too long ago in a cloud server far far away, a disk slowed down to a crawl. That server was our analytics server, responsible for keeping track of game views, downloads, and all that good stuff. Instead of writing to the disk at our usual rate of a few MB/s, we were getting a whopping total of 9 KB/s.
The main thing affected by the slow disk is the time it took to fetch analytics data from our web servers. Every time someone tried viewing their game analytics in their dashboard, or even the quick stats page - it took forever. These requests should have timed out after 30 seconds or so but they didn’t.
Apparently, time spent waiting on IO (reading or writing from disk or network, in our case waiting for a response from the analytics server) does not count towards the overall request timeout. Requests started slowly piling up.
In fact, they piled up so high we eventually ran out of resources to handle new requests, and users all over started experiencing that dreadful internal server error at random. Ungood.
In an effort to minimize the damages until Linode’s cavalry arrives we disabled all services that had anything to do with our analytics:
Analytics pages. Sometimes we were able to gracefully return no results, other times we had to straight up throw a 404 in your faces. Sorry :(
Counting views, downloads, post expands, etc
Calculating revenue, which depends on these metrics
… and our task processor.
Oh yeah, the task processor also handles processing game builds. All new game builds uploaded to the site would not go through until the task processor is turned back on. You could still upload builds but it’d be stuck in this state:

Shocks you for 2 damage
It’s been around 24 hours, we are still dealing with the fallout when the disk attached to our DB craps out too and slows down as well. No lasting damage was done (except a few lost brain cells), but it managed to throw us off for a while. The timing of the DB misbehaving made it seem like it’s related to our analytics server somehow. The goose chase was glorious.
Linode pulled through! All disks are looking good, the site is going back online… or is it? It’s very slow, and users are still randomly disconnecting. Looking at our web servers it seems that they are not sharing the workload equally. Some are collapsing under stress while the others are chilling.
Seems like the uneven workload is caused by our real-time notifications. You know, those messages that pop up in the corner whenever you get a comment or an upvote or whatnot:

The way these notifications work is pretty simple. Instead of having your browser constantly ping us and ask “hey, do I have any new notifications?”, it creates just this one connection. That connection stays open for the entire session and we push the notifications through it as soon as they happen.It seems a few of our web servers were handling most of these connections while others were barely handling any - causing an uneven workload.
We figured this must be because of the random disconnections people were having earlier in step 4. When a browser loses the connection to the real-time notification service it attempts to reconnect. Those reconnections go through our load balancers first, and since some of our web servers weren’t able to handle these new connections (courtesy of the piling analytics requests from steps 2-3) most connections just happened to end up on only a few of our servers when the dust finally settled.
This means forcing everyone to reconnect should solve this! Now that the servers are up and running we can just restart the real-time notifications service, all browsers would try reconnecting and this time the workload will be spread evenly! That was too optimistic.
As soon as we restarted the service the site went down. Thing is, we should be perfectly capable of handling these reconnections. When the browsers lose their connection to the real-time service we make them wait some random time before reconnecting. This makes sure that we don’t get hammered with every reconnection at the same time, and evidently, our web servers weren’t showing signs of unmanageable stress, so what gives?
Apparently, our load balancers were misconfigured: they had a very low rate limit on new connections. This caused a nice little chain reaction, a domino effect, no, DOOMino effect starting with…
Requests randomly failing. Whenever people tried navigating the site at that point, they encounter errors. These errors forced them to refresh which of course meant they had to reconnect to the real-time notifications service again. A feedback loop from hell.
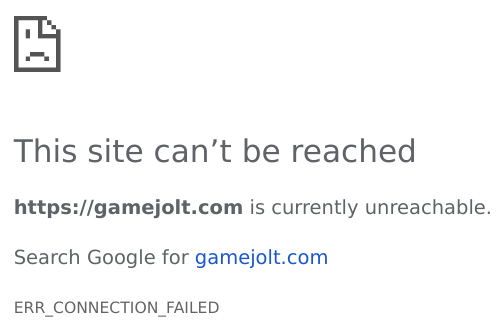
Also, since the load balancers hit their rate limit it also meant they were not responding to DNS health checks. Without getting too technical the bottom line is when people tried connecting to gamejolt.com their browser couldn’t even know where it needs to connect to. You wouldn’t even get to see our nice customized error page, you’d just get this:

Horrible.
We raised the connection rate limit, the site went back up and for the first time in 2 days, it was fast again, too! We’re almost there, the only thing that’s left to do is to turn the task processor back up. It was down since step 5 for almost an entire day now. We’ve accumulated around 117k tasks queued up. It’ll take a few hours to catch up, except…
The server the task processor was on immediately exploded. The task processor is supposed to handle tasks only a few at a time, a reasonable pace to catch up while still keeping afloat, but according to the process list - it was apparently trying to extract and compress around 100 game builds concurrently. We still can’t locate that ghost in the machine. Before this whole ordeal, the task processor’s been happily chugging along with a nice uptime of a few months. There weren’t any recent changes to it either.
Luckily, the illogical attempt to just “turn it off and back on again” did the trick.By now the gaps in the analytics from the past 2 days have been fully backfilled, the task processor has finished running through its backlog, and if you were online while that was running you were probably generously spammed with notifications for all the things you missed, as is customary. The last item on the list is to recalculate your ad revenue for the past few days.
Conclusion
Victory at last! There was no data loss and all the performance issues we were having have been mitigated. We learn from every incident, this one is no exception. We have a solid plan to prevent such issues from happening again in the future :)
Thank you, Linode for reaching out to help resolve the disk issues, and a HUGE thank you to our community for bearing with us this week. We received so many encouraging and understanding messages which fills us with determination!
* p.s. do people still post a potato at the end of a long post?


41 comments