Hello there, Nesh here!
Today I am going to talk about something not strictly related to Tales of Kulplex but it’s a topic which influences our workflow on a day-to-day basis: compile times.
Actually, as I ended up discovering during my quest, what the “spinning wheel” or this message means

is actually not only the literal code compilation part but also, even more importantly, the reloading of the assemblies and files (the “app domain”).
That is something I was not aware of few days ago, I had just grown accustomed to save, switch to the Editor and then check my emails, messages or just go and grab a cup of tea.
For some reason, I started realizing that having to wait 12-14s each single minuscule change is not a healthy workflow and something must be really wrong.
After a bit of research, I started noticing a lot of other developers complaining about such issues, especially in the light of “one Goal of Unity” by Joachim.
Here I will now present my adventure, introduce some of the tooling I used (in case you want to replicate it) and the discoveries I made about Unity.
Scroll to the end of the article for a TL;DR.
Getting Started
First of all, before even starting to think about any of what I just mentioned, a few things are needed:
Push all your latest changes to git (if you don’t use git, you really should)
Benchmark your current setup
It’s very important to know the starting point. Sometimes a tiny change can actually make things worse and we want to know exactly by how much.
What I used is the following Editor script: AsmdefDebug.cs
After running that, I discovered that my initial compilation/reload time was around 14 seconds.
Notes on Methodology
In this post I will be sharing techniques which led to my project decreasing its overall compile/reload times.
The compilation was always triggered with an identical change (add/remove empty line) and in the same computer state (same processes running and same configuration).
For each change, I took a screenshot of the result closest to an average time.
It is to be noted though, that the results are also influenced by whatever else the computer is doing in that specific window of time, this means that sometimes some results might end up having slightly better or worse results.
The overall goal of the post is, first of all, to give an understanding of how to even approach this issue and what changes made my specific configuration faster.
Using built-in Assembly Definitions
My first step was to make use of the Assembly Definitions present in Unity, as it is a common approach to save compile time.
Assembly Definitions are a way for organizing your code into separate DLLs. This helps with keeping code together but also with not having to re-compile everything for a single change on a file.
Unity has some already pre-defined but it’s possible to add custom ones.
This is the reason why any Unity project is split into the following parts:

Here is what they briefly mean:
Assembly-CSharp
This is the default assembly, this code gets re-compiled every time. Useful for frequently changing user-made code.
Assembly-CSharp-Editor
This is the default assembly for any code put inside an Editor folder. Also gets re-compiled every change.
Assembly-CSharp-Editor-firstpass
This is the firstpass assembly for editor scripts, this code gets re-compiled only if changes are made in the code within this assembly.
When a full re-compilation is triggered, it’s the first one to be compiled (hence the firstpass)
Assembly-CSharp-firstpass
Same as the editor version but for the other code.
Basically, here is what Unity does:
Compiles everything the first time, firstpass assemblies are generated first and then the rest
Any change within firstpass assemblies triggers a complete re-compilation
Any change within a default assembly triggers a partial re-compilation (skipping the firstpass)
Any user-defined assemblies behave like the firstpass (I won’t go into this in this post)
This clearly show us that, if we want less stuff to be compiled, we should put rarely modified code inside the firstpass assemblies, while keeping the rest outside.
That’s all good but there is a catch: code in separate assemblies cannot directly reference each other (except for default assemblies, since they are re-compiled every time).
So, your code from the ‘default’ assembly can use functions from the firstpass assembly (for example using a library) but not vice versa.
This is usually fine for most code imported from the Asset store, since they are usually standalone.
In order to get a super quick and easy speedup, we just need to group all the libraries, imported assets and standalone code inside one of the following Special Folders:
Standard Assets
Pro Standard Assets
Plugins
The code here will end up in the Assembly-CSharp-firstpass (or firstpass-Editor).
There are more of these special folders but these are the ones you can use for generic code, the others are for specific code (like Editor scripts, Gizmos, or runtime resources).
Already by doing this, we can get some sweet speed-up:

This is because we are using several big frameworks, once they are moved inside the Standard Assets folder, they don’t need to be recompiled every time (this was extremely easy as we just had to rename our Tools folder).
Removing Unneeded Files
It turns out that the Editor actually goes through each and all the files present in the Assets folder. This led me to try to remove as many unused files as possible.
This was actually quite easy as a lot of assets come with Documentation/Docs and Demo/Example folders, filled with goodies but also with not really useful stuff.
Removing those helped slightly:

Going Deeper
This was a nice improvement but it was not nearly enough. I wanted to get more outstanding results, so I went a step deeper.
The main issue I found while working on this problem was the lack of truly understanding where the Unity Editor spending its time on.
I am currently on Windows, so I used the Process Monitor and started digging:
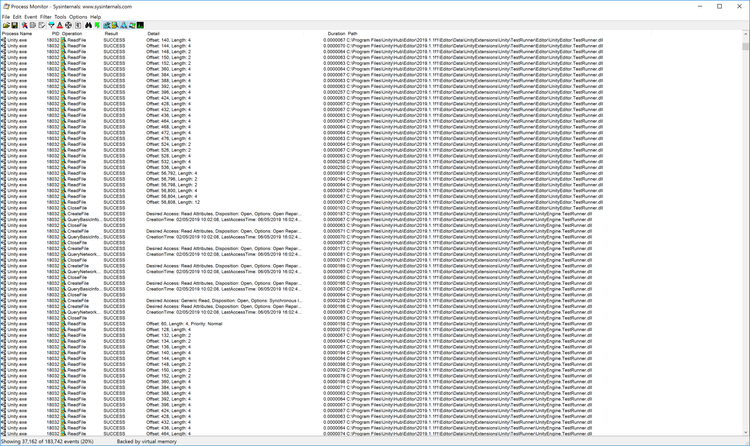
With this little neat tool, it’s possible to see at any given time what your processes are doing, record them, filter by action, state, duration and get some nice analysis out of it.
And for a given process, you can also get a File Summary, which summarizes how long a specific file took:
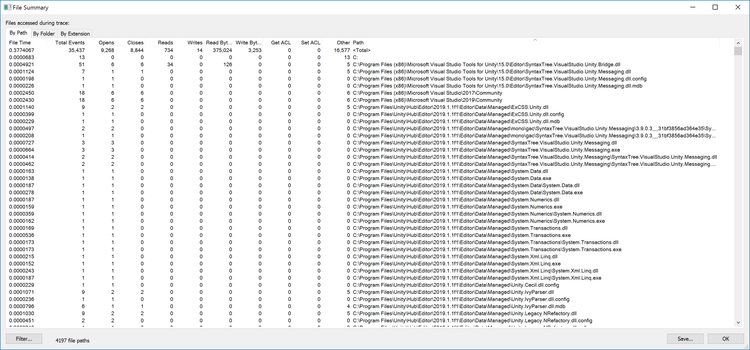
This was extremely useful to understand how to move forward and scrape few extra precious seconds.
Removing Unneeded Packages
From the Process Monitor, I started noticing certain DLLs being re-loaded every compilation.
They sounded familiar, as they are the default packages provided by Unity. They can be found in the Package Manager:
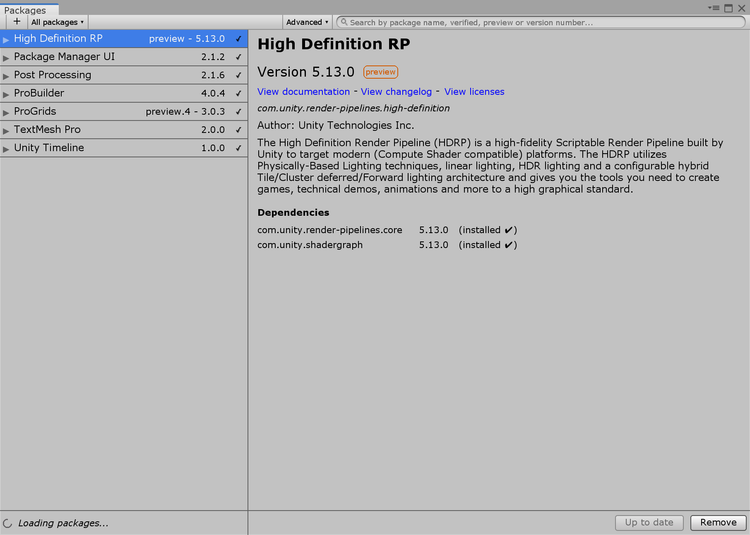
Some of these sound cool and useful but, if your game doesn’t need them, you’re better off removing them (even just temporarily).
Here are some quick results after removing certain packages we didn’t need:
Ads removed:

IAP removed:

Analytics removed:

XR Legacy removed:

Multiplayer HLAPI removed:

Memory Profiler removed:

Even Deeper
I noticed that some slowdown was due to lots of spamming by Visual Studio and Unity.
VS kept on notifying git of changes while Unity wanted to check some registry values which were not available.
The git issue is exactly what also kalineh found out in their detailed post.
Turning off the Source Control tool in VS can be done in the settings:
Tools->Options->Source Control->Plug-in Selection: choose None, restart Visual Studio
Concerning the missing registry values, I simply added two empty Binary values to HKCU/SOFTWARE/Unity Technologies/Unity Editor 5.x (the keys are probably specific to my installation) that seemed to be enough:

Since I was there, I also cleaned and rebuilt the whole project (through VS).
All that brought some substantial improvements!

Unity + IDE
After several analyses, I started noticing that Unity and the IDE (Visual Studio) actually communicate a lot during a compilation.
That’s expected but it made me wonder whether certain things could be disabled to get even more performance.
It turns out that a lot of the talking is enabled/disabled by this little setting:
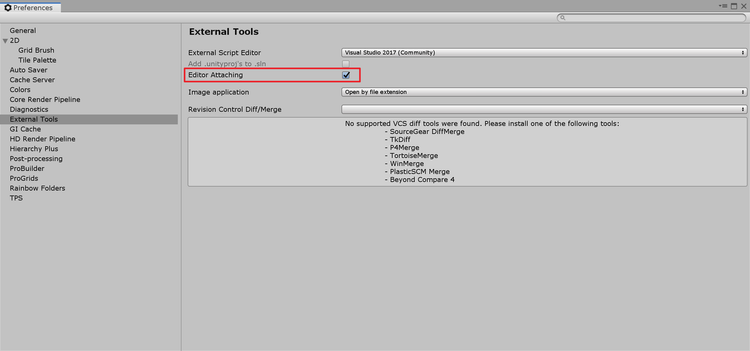
Disabling it actually yield some 0.3-0.5s improvement:
Default (VS 2017):

No Editor Attaching:

But that also disabled the Attach Debugger feature, which is extremely useful.
Together with that, enabling/disabling this setting requires restarting the Unity Editor (about 2/3 minutes), making the 0.3s improvement utterly useless…
For fun, I gave a try to also change the IDE version (I still use VS 2017 but I have the 2019 version as well):
Default (VS 2019):

No Editor Attaching:

And also tried using Sublime and VS Code:
Sublime:

VS Code

The changes between IDEs were really minor and often due to just randomness.
Conclusions
Here is a little visualization of the improvements that I manage to achieve during this mad exploration:
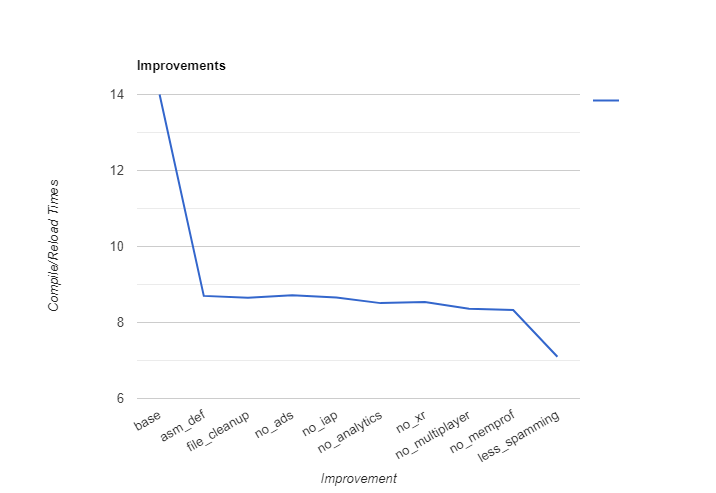
Some questions did arise: Was it worth it?
Did me spending so much time and energy not actually producing anything make any significant impact?
Or was it a failure? Interesting, but a failure nonetheless?
Since we try to stay objective and not get too lost in emotions (yeah, 7s for changing a single line of code is still awful), I thought to compute how long it would take for this “improvement” to pay back.
Doing the Maths
I estimate having spent a total time of 5 hours in researching, benchmarking, discussing it and generally being obsessed with this.
The final improvement was around 7 seconds per change reflected in the editor (Unity doesn’t reload everything if you just stay in the IDE).
On a normal day, I might go back and forth the editor 50 times to see the changes and test things out.
5 hours used for research * 3600 = 18000 seconds
18000s / 7s (saved seconds per compile time) / 50 (changes/compiles per session/day) = 51.4 days needed to pay for this adventure
Basically, around 2 months of work before I will start reaping the benefits of this 7s improvement. And this is only accounting for 1 developer.
It’s in the future but we have been actively working on this project for more than a year now, so it might actually not have been such a lost cause… Yay!!! :D
TL;DR.
How to decrease compile times in Unity:
Put imported assets/libraries or rarely changed code inside the
Standard AssetsorPluginsfolders (names must be exact)Remove unused default packages
Remove unused files (the more the better)
Optional: Disable source control from your IDE
Crazy: Disable
Editor Attaching(if you don’t use it, you probably need it)For large projects: Create additional
Assembly Definition Filesand use them to segment your codebase even more (https://docs.unity3d.com/Manual/ScriptCompilationAssemblyDefinitionFiles.html). Can lead to slowdowns when done improperly.
I hope this little tutorial was helpful for you and brought you some sweet speed-ups, without having to upgrade your hardware.
If you end up spending a couple of hours for just few seconds, it might actually be something which builds up in more productivity in the not-so-far future.
And, as usual, you can get in touch with us and stay up-to-date:
Discord: https://discord.me/talesofkulplex
Facebook: https://www.facebook.com/talesofkulplex/
Twitter: https://twitter.com/talesofkulplex
If you want to discuss this topic further, feel free to comment or reach out if you have other insights :)
Take care!
Nesh







2 comments